PolyinterpDemo.m
Contents
Overview
Illustrates polynomial interpolation by calling polyinterp from NCM (which evaluates the polynomial interpolating the data in the vectors x and y at the list of points in the vector u)
As output we get plots of
- the data,
- values obtained from polyinterp,
- and a smooth MATLAB graph.
Initialization
clear all
close all
% Define the data and evaluation points
x = [2 2.5 4];
y = [0.5 0.4 0.25];
u = linspace(1,5,20)
u =

  Columns 1 through 10

    1.0000    1.2105    1.4211    1.6316    1.8421    2.0526    2.2632    2.4737    2.6842    2.8947

  Columns 11 through 20

    3.1053    3.3158    3.5263    3.7368    3.9474    4.1579    4.3684    4.5789    4.7895    5.0000
Call polyinterp
Evaluate quadratic polynomial interpolant at all the points in u
v = polyinterp(x,y,u);
Plots
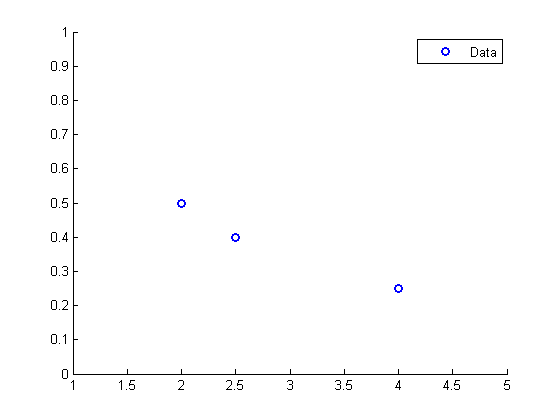
Plot the data
hold on
xlim([1 5])
ylim([0 1])
plot(x,y,'bo','LineWidth',2)
legend('Data')
pause
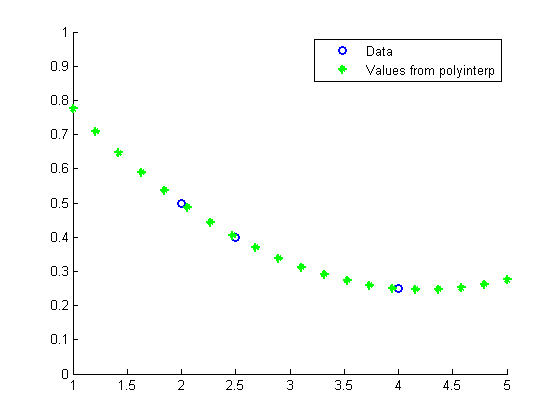
Plot the values computed with polyinterp
plot(u,v,'g*','LineWidth',2)
legend('Data','Values from polyinterp')
pause
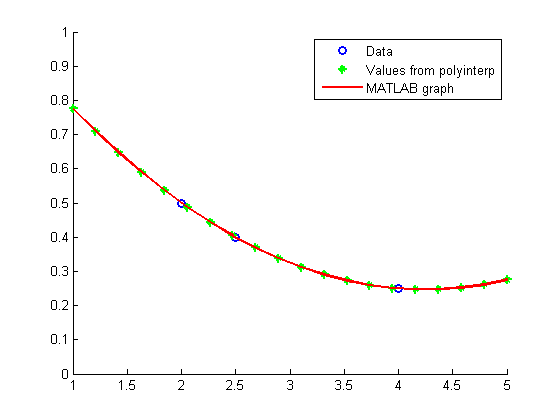
Let MATLAB do some more interpolation to get a continuous graph
plot(u,v,'r','LineWidth',2)
legend('Data','Values from polyinterp','MATLAB graph')
hold off